Required Context
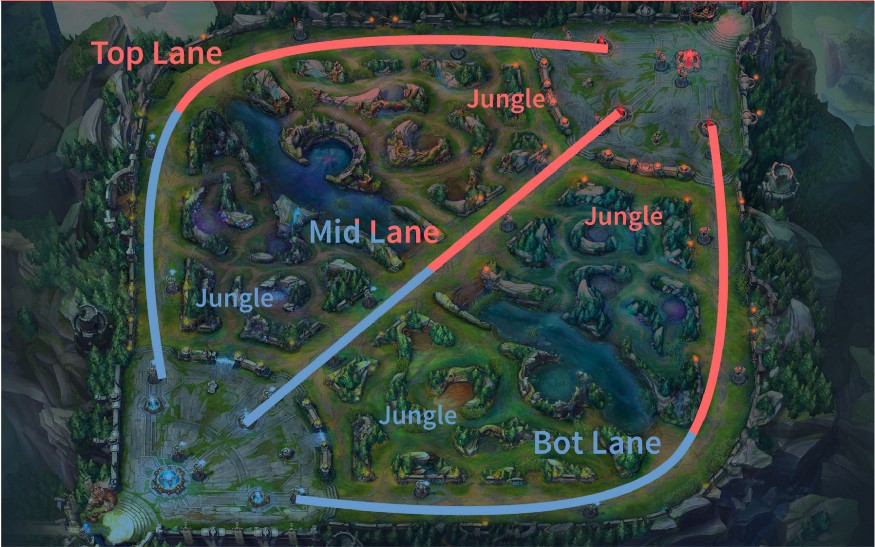
League of legends is a multiplayer online battle arena game with 100 million + active players (summoners). Every game has two opposing teams of 5 players, each taking a different role. Each player can choose from any of ~150 champions (characters) and each champion is associated with one or more roles or playstyles.
Goal
The goal of this project is to explore and visualize the character/champion preferences of league of legend players, create a visualization and a recommender system based on most played champs of a player.
Data Collection
The Riot games api gives access to pretty much everything needed to get player preferences. Ideally, one would get the total number of games played for a given player and then partition them according to the champion played and use this as the dataset. Unfortunately, given the rate limit on the api on a free api key it would be extremely slow to take this approach as it would require 100+ calls per player to get at least a representative look at the champions played.
In order to get around this, the champion masteries variable was used. Every time a player plays a game with a champion the accumulate a small amount of mastery points for that specific champion based on how well they did. So the total mastery points can be used as an estimator of the games played although it is also reflective of performance. Champion mastery information for a given player can easily be accesed through a single cass via the Riot games api so it is way more practical given the rate limitting.
Players were found by using my own account as a seed and then crawling through the games in match history. Game types, player ranks were not taken into account since it is assumed that those shouldn't impact the connection between played champions and actual preferences. This may not be the case at the very highest tier of ranked gameplay where character preferences are dictated more or less by the meta but those players/games if included at all make up an insignificant percentage.
In total ~70k players mastery points were collected, the head of the resulting dataframe for the first 10 columns is shown below.
| summoner | Aatrox | Ahri | Akali | Alistar | Amumu | Anivia | Annie | Aphelios | Ashe | |
|---|---|---|---|---|---|---|---|---|---|---|
| 0 | Mandelion | 3374 | 5502 | 4743 | 6833 | 12782 | 4174 | 12382 | 855 | 2446 |
| 1 | NostàroiCaphalor | 5746 | 45956 | 249 | 17628 | 11973 | 2221 | 59095 | 0 | 3552 |
| 2 | RiftLurker | 4146 | 95507 | 19794 | 24849 | 13790 | 48370 | 15485 | 7531 | 52714 |
| 3 | SimonDeen360 | 15075 | 13473 | 11938 | 71794 | 7453 | 9348 | 7369 | 4088 | 59983 |
| 4 | Lateox | 3025 | 21071 | 3993 | 5191 | 1272 | 4086 | 3561 | 22132 | 22324 |
Data preprocessing
The first step was to remove all rows of players with very few low mastery points, as such players would show misleading correlations based on very few actual games playes. Specifically players with no champion with at least lv 5 mastery (21600) points were filtered out, a total of about ~5k players.
Since we are only interested in player preferences, information about total mastery points is not needed, only the composition of the total is relevant. To remove this irrelevant information, each row was divided by its max resulting in a purely compositional dataset.
Before continuing the analysis, zero values needed to be dealt with as most approaches to compositional data analysis require fractions which can of course not be taken with 0 values. There are various approaches to replacing these zeros, after reading this paper on the topic I chose the multiplicative replacement approach with replacement value the minimum points gained from a single game.
Due to the inherently relative nature of compositional data classical statistical techniques can't be directly applied without risk of misleading results. After some research I decided to use rho and phi metrics approach for compositional data in place of normal correlation analysis, as detailed here. This approach requires the data to first be transformed using a centered log-ratio transformation (clr):
The python libray scikit-bio has many useful tools for compositional data including multiplicative replacement and clr.
Analysis
Unsupervised learning
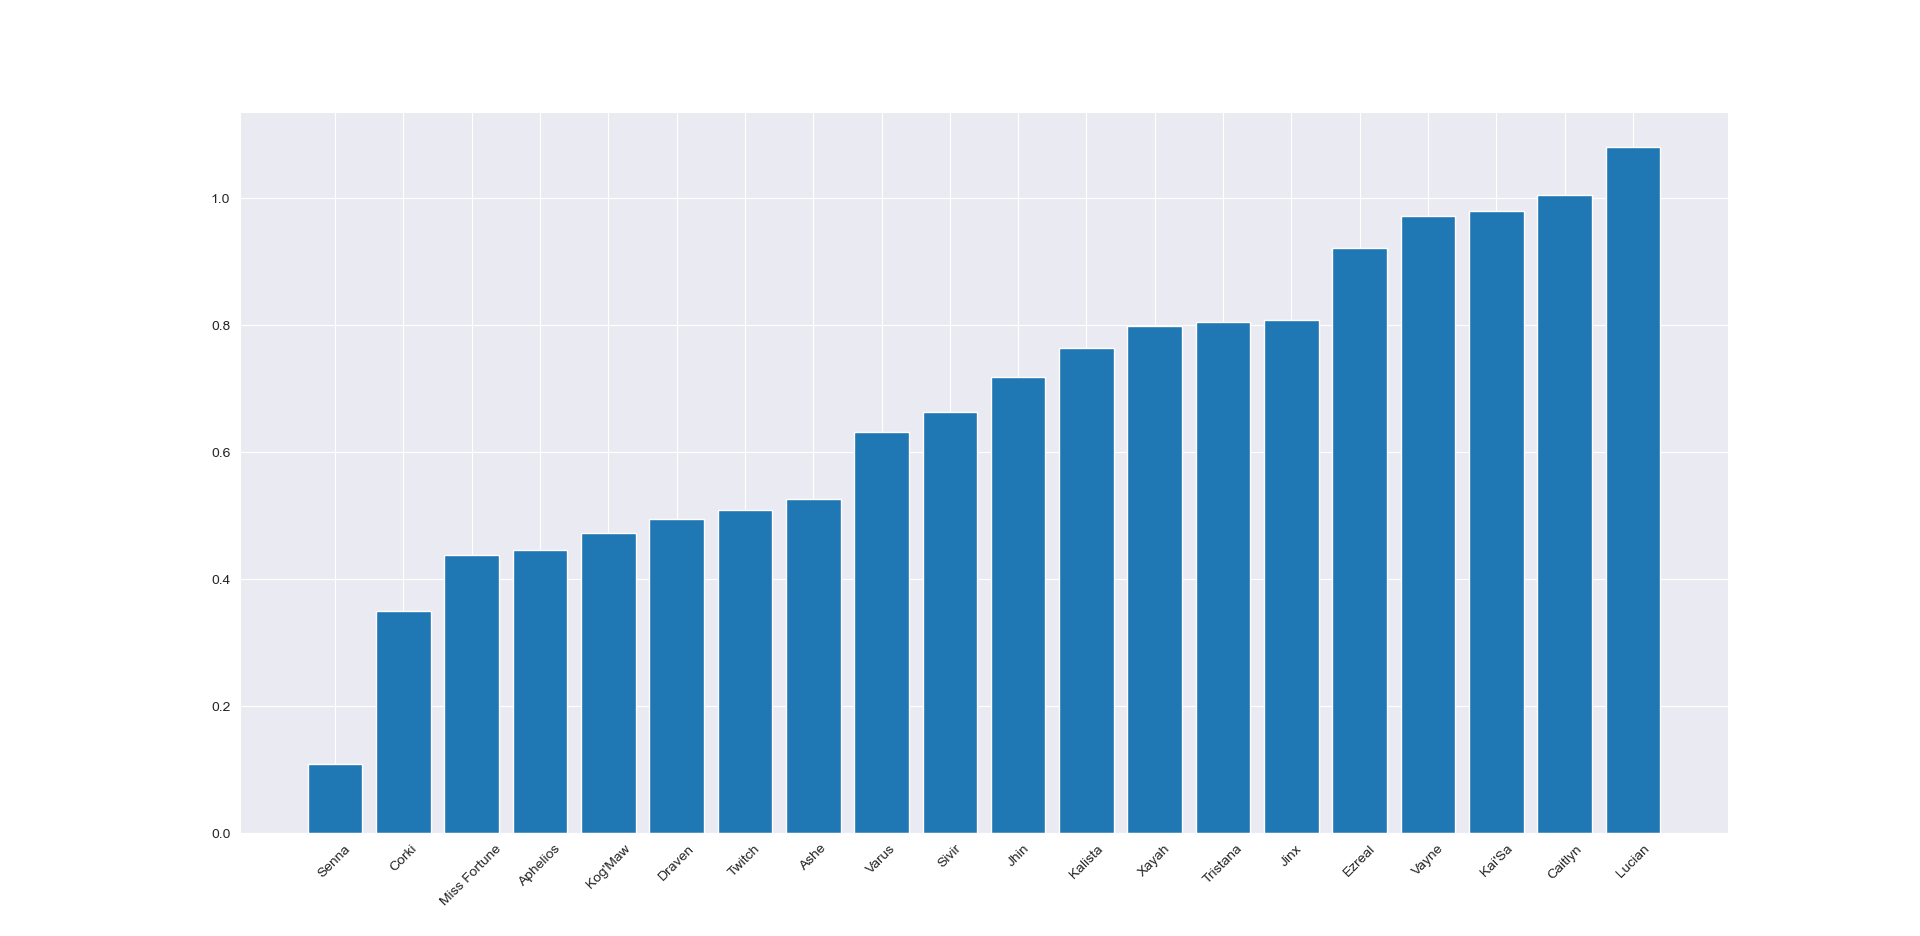
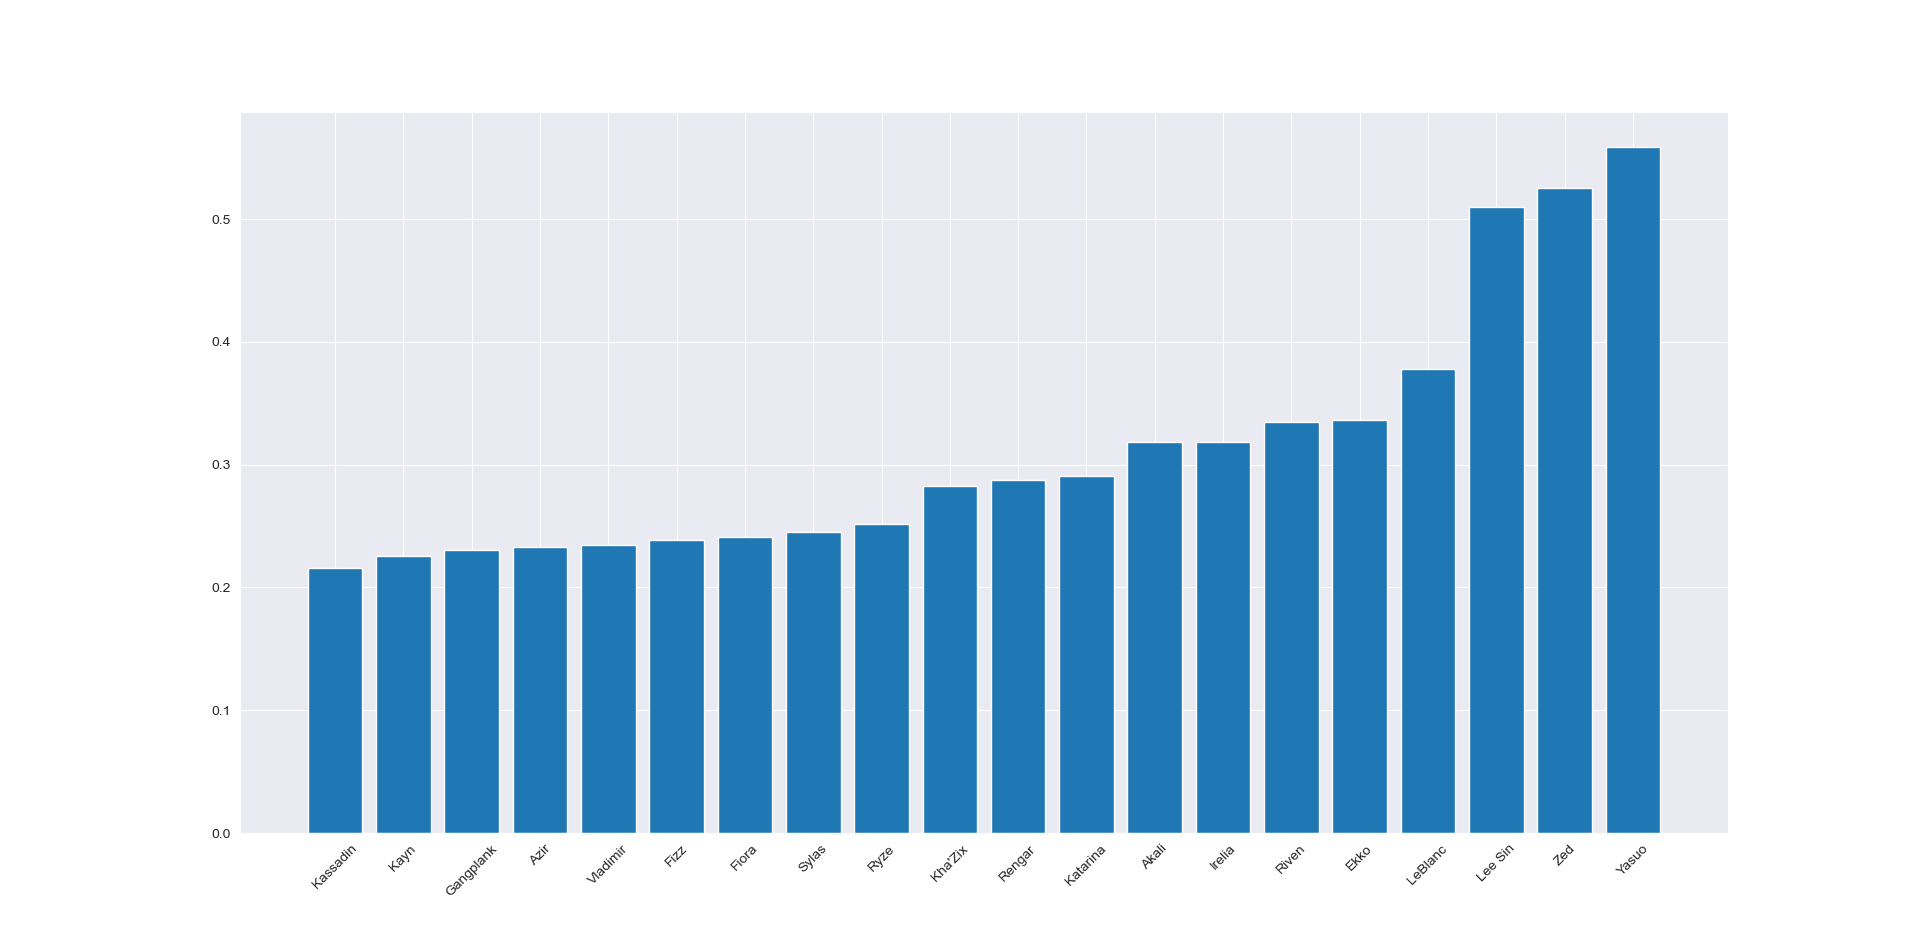
After preprocessing I tried using unsupervised learning techniques to cluster the data, in hopes of obtaining semantically recognizable clusters of champions. K-means feature agglomeration (essentialy kmeans on the transposed data) gave groupings that loosely relate to the 5 roles in the game, for example the following pictures show two clusters, the first containing only marksman champions so being quite accurate and the second containing a mix of flashy solo lane (mid,top) champs so not strictly a role but pertaining to a common player type. An exact match between clusters and roles would have been unlikely given that many champions are played in multiple roles and of course players play multiple roles.
I also applied full hierarchical clustering, the dendrogram provides an interesting visualization of the preferences but was not used for the network visualization.

Rho and Phi correlation metrics
Correlation matrices were constructed using both metrics, rho takes values in [-1,1] and can be interpreted as the pearson coefficient, the phi metric takes values in [0,+∞] with larger values incicating lower correlation.
Network visualization
Now that we have both the clusters and the correlation matrices we can create the champion network. Each node represents a champion and is scaled by the total sum of the column in the compositional datset, essentially the popularity of a given champion. Each node is then connected to the 6 nodes it is most highl correlated with based on one of the correlation matrices. The number 6 was chosen through trial and error as larger values seemed to produce overly connected networks since correlations tended to drop off. The width of these connections are also scaled based on the correlation, forming a weighted graph. Finally, the nodes are colored according to the clusters produced through K-means.
The network was constructed using networkx and then imported into pyvis for visualization.
The champion network
Champion recommender
Given this network there are various ways to create a recommender system. One reasonable way is to use the weighted path length between nodes. Specifically, for a given set of input champions, the average shorted weighted path length is calculated for each champion not in the input set. The champion with the smallest such distance is then the recommendation for the givne input. So the reccomendation is essentially something like a "graph center" of the given nodes.
The distance is calculated using the dijkstra algorithm implemented in networkx and is suprisingly fast although such an approach could likely only be scaled by using extensive caching.